

Capturing SMART Statistics from Synology drives with SNMP
I have been a Synology user for over 6 years now, and since I’ve already got a comprehensive set of Grafana dashboards set up to monitor my home systems, I decided to get one going for the NAS too. Thankfully, a great monitoring dashboard already exists. It’s pretty slick, shows all the basic info you’d want to have. That dashboard relies on Telegraf to poll the NAS for SNMP data, and the author created a sample configuration file.
I’ve also been a Backblaze user for many years, both their backup service as well as B2 object storage. One of my favorite things about Backblaze is that they publish a lot of great info about hard drive reliability, including SMART data (the standard for reporting various metrics about the health of a drive).
Since my Synology also has a bunch of drives running 24/7, I want to capture data about those too, and I’d like them on the dashboard.
First, the data for SMART attributes for each of the drives in a Synology is available in the following SNMP table: SYNOLOGY-SMART-MIB::diskSMARTTable.
To take a look at it ensure you have snmptools installed locally, as well as the Synology MIB files installed, and use the following command (replacing YOUR_SYNOLOGY_IP with the IP of your Synology):
snmptable -v 2c -c public YOUR_SYNOLOGY_IP SYNOLOGY-SMART-MIB::diskSMARTTable
Add it to the configuration file by appending the following code to the example telegraf.conf in the repo above.
   # SMART Attributes
   [[inputs.snmp.table]]
     oid = "SYNOLOGY-SMART-MIB::diskSMARTTable"
     [[inputs.snmp.table.field]]
       is_tag = true
       oid = "SYNOLOGY-SMART-MIB::diskSMARTInfoDevName"
     [[inputs.snmp.table.field]]
       is_tag = true
       oid = "SYNOLOGY-SMART-MIB::diskSMARTAttrName"
     [[inputs.snmp.table.field]]
       oid = "SYNOLOGY-SMART-MIB::diskSMARTAttrId"
     [[inputs.snmp.table.field]]
       oid = "SYNOLOGY-SMART-MIB::diskSMARTAttrCurrent"
     [[inputs.snmp.table.field]]
       oid = "SYNOLOGY-SMART-MIB::diskSMARTAttrWorst"
     [[inputs.snmp.table.field]]
       oid = "SYNOLOGY-SMART-MIB::diskSMARTAttrThreshold"
     [[inputs.snmp.table.field]]
       oid = "SYNOLOGY-SMART-MIB::diskSMARTAttrRaw"
     [[inputs.snmp.table.field]]
       oid = "SYNOLOGY-SMART-MIB::diskSMARTAttrStatus"
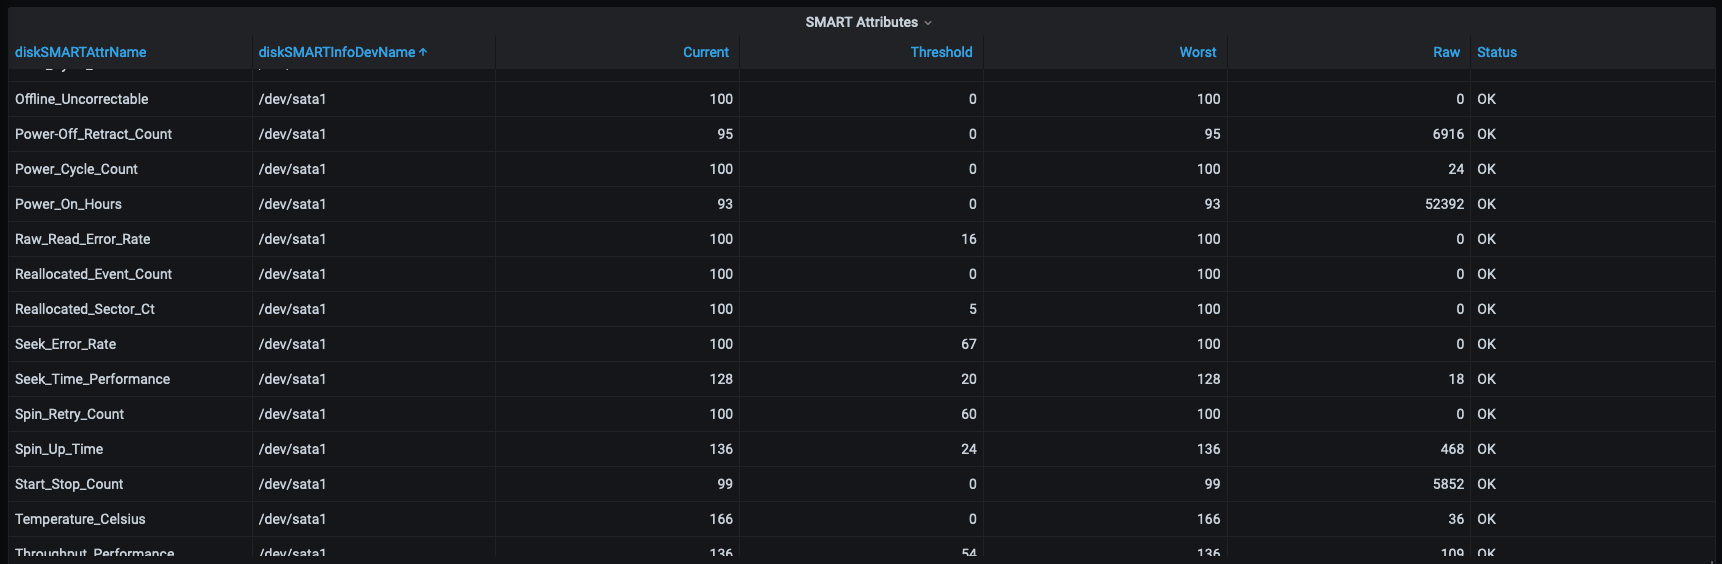
Next, add a panel to the Grafana dashboard, with the following query:
SELECT last("diskSMARTAttrCurrent") AS "Current", last("diskSMARTAttrThreshold") AS "Threshold", last("diskSMARTAttrWorst") AS "Worst", last("diskSMARTAttrRaw") AS "Raw", last("diskSMARTAttrStatus") AS "Status" FROM "diskSMARTTable" WHERE ("agent_host" =~ /^$host$/) AND $timeFilter GROUP BY "diskSMARTInfoDevName", "diskSMARTAttrName"
Now we have a nice table with all the SMART attributes most recent values
This dashbord has been shared for importing directly into Grafana at ID 14548